Numbers That Sound Right
Ask any AI what a role should pay and you’ll get something crisp: clean ranges, tidy percentiles, confident tone. For HR on deadline and teams chasing parity, it feels like progress.
Too often, though, those figures come from thin inputs, scraped postings, fuzzy titles, stale samples, and models trained to sound plausible, not proven. Press for sources, time windows, or normalization rules and the certainty evaporates. No repeatable method. No source hierarchy. No audit trail.
The result? Confidence outruns credibility. Guesses harden into “market” benchmarks, and organizations pay the price.
This series explores why these numbers sound right but often aren’t, and how to tell the difference. Curioz looks at what to verify, what real transparency means, and the data practices that keep pay decisions grounded in truth.
Precisely Uncertain
Large Language Models (LLMs) are the new cheat code for practical questions, salaries included. Ask, “What is the salary of a Senior DevOps Engineer with 6+ years of experience, working full-time and remotely, in Poland?” and boom, a confident-looking, well-formatted answer appears in a minute. No dusty benchmarking reports. No manual data pulls. No spreadsheets. Sounds dreamy… almost too dreamy. So, what’s the catch?
We are naturally Curioz, we couldn’t resist testing it. we have asked these questions:
- Does the model actually give you the numbers you can rely your business decisions on?
- What if you run the same prompt again and again, in fresh sessions and clear cache?
- Do the numbers reasonably line up or change significantly every time?
So we ran a simple test. No peeking under the hood. No “explain your methodology” no “how many job posts did you check?” or “which job boards did you check?”. We simply asked AI to analyze current-month job boards and return three numbers: Low, Median, and High salary bands for that role.
Consistency was the goal. Not a lab experiment, not insider access, just regular users, pressing Enter like everyone else.
The Shortcut Too Good to Be True
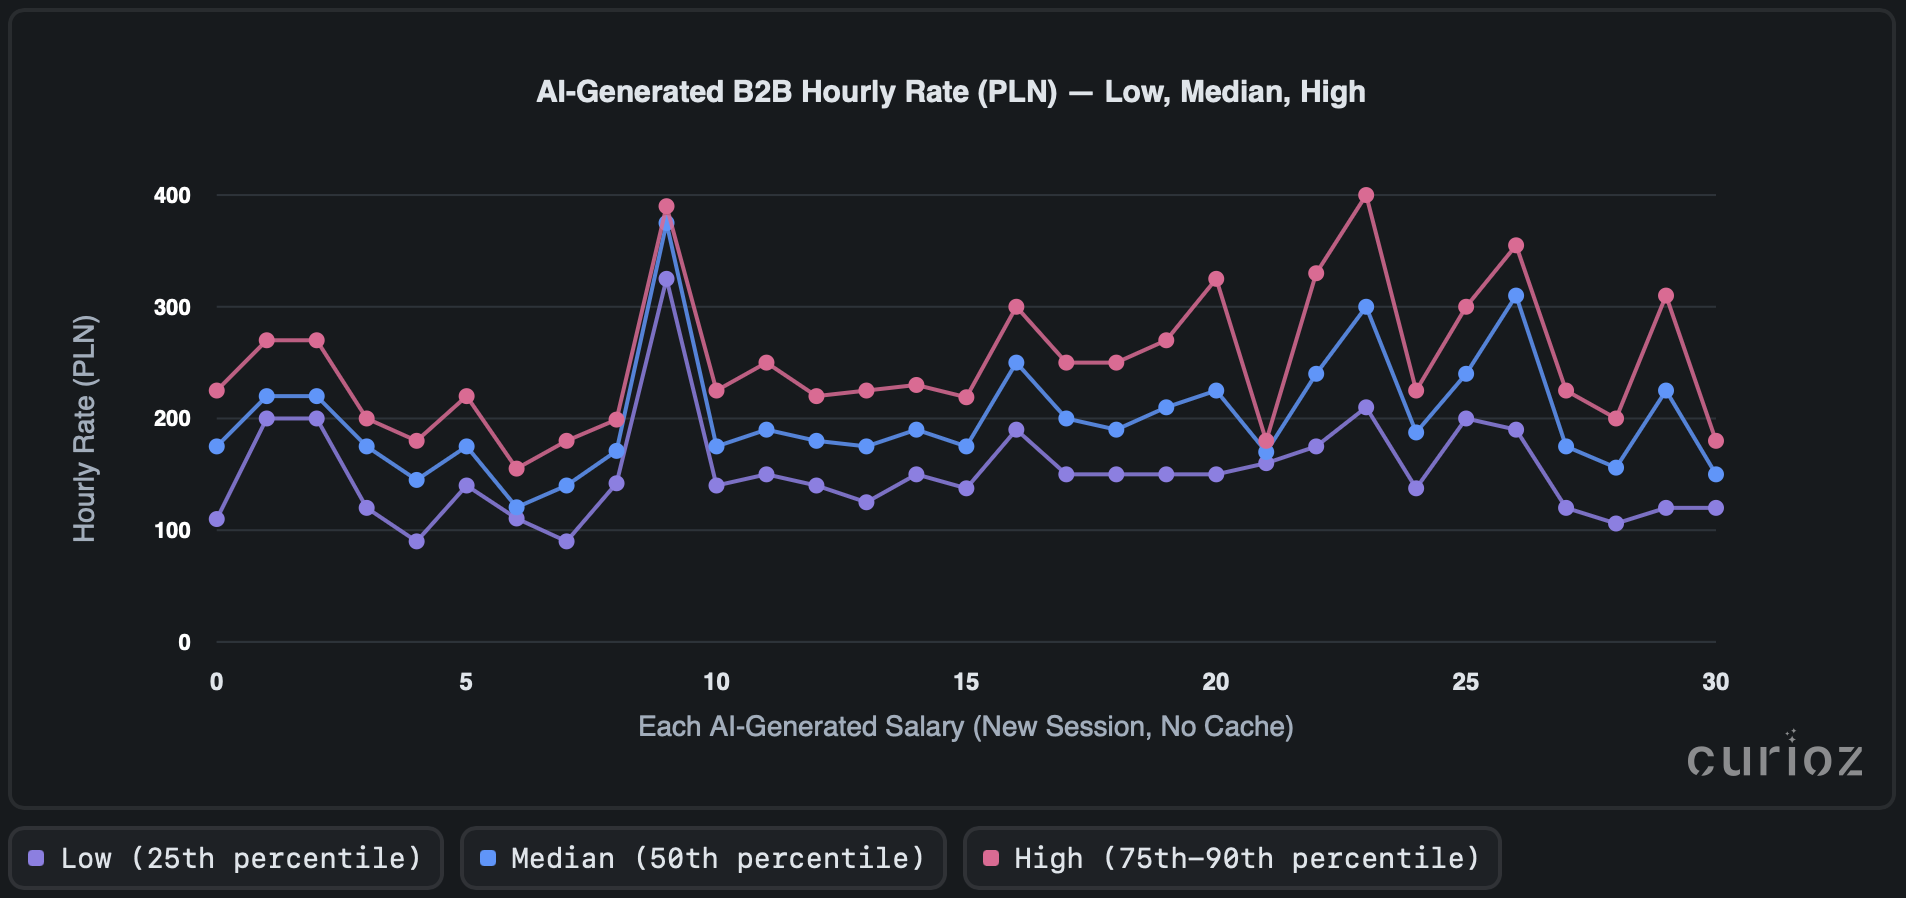
We asked an AI the same question about mentioned Senior DevOps Engineer many times in fresh chats, clear cache. Each time, it generated numbers for Low, Median, and High pay across B2B hourly, daily, and UoP monthly rates in the same response. The three charts plot those repeated answers so you can see how much results move around from run to run.
-
Low ≈ what smaller or more conservative payers might offer (around the 25th percentile).
-
Median = the middle of the market (50th percentile).
-
High = strong but still realistic offers (roughly 75th–90th percentile).
So what happens when you ask an AI the same question over and over? Let's take a look.
Across multiple runs, estimated hourly rates may look like cluster around ~153 PLN/h, ~203 PLN/h, and ~253 PLN/h. However, more than half of paired runs differ by 25–30% or more, indicating substantial variability.
Single iterations can swing by 40–50 PLN/h, with occasional deviations ranging from 100 PLN/h to 400 PLN/h. Rate lines fluctuate noticeably between sessions; some runs appear systematically more generous, while others are more conservative. Overall, the spread shows concerning volatility and the presence of outliers.
Daily-rate results show, what can look like a typical stability zone punctuated by sharp, irregular spikes. On closer inspection, individual peaks differ by hundreds of PLN, occasionally exceeding 4,000 PLN/day on the upper end. While such results might appear plausible in isolation, side-by-side comparisons expose them as clear outliers. Roughly 70% of repeated “identical” runs vary by ≥25%, confirming significant run-to-run inconsistency. In practice, this means that single-run results cannot be treated as stable indicators.
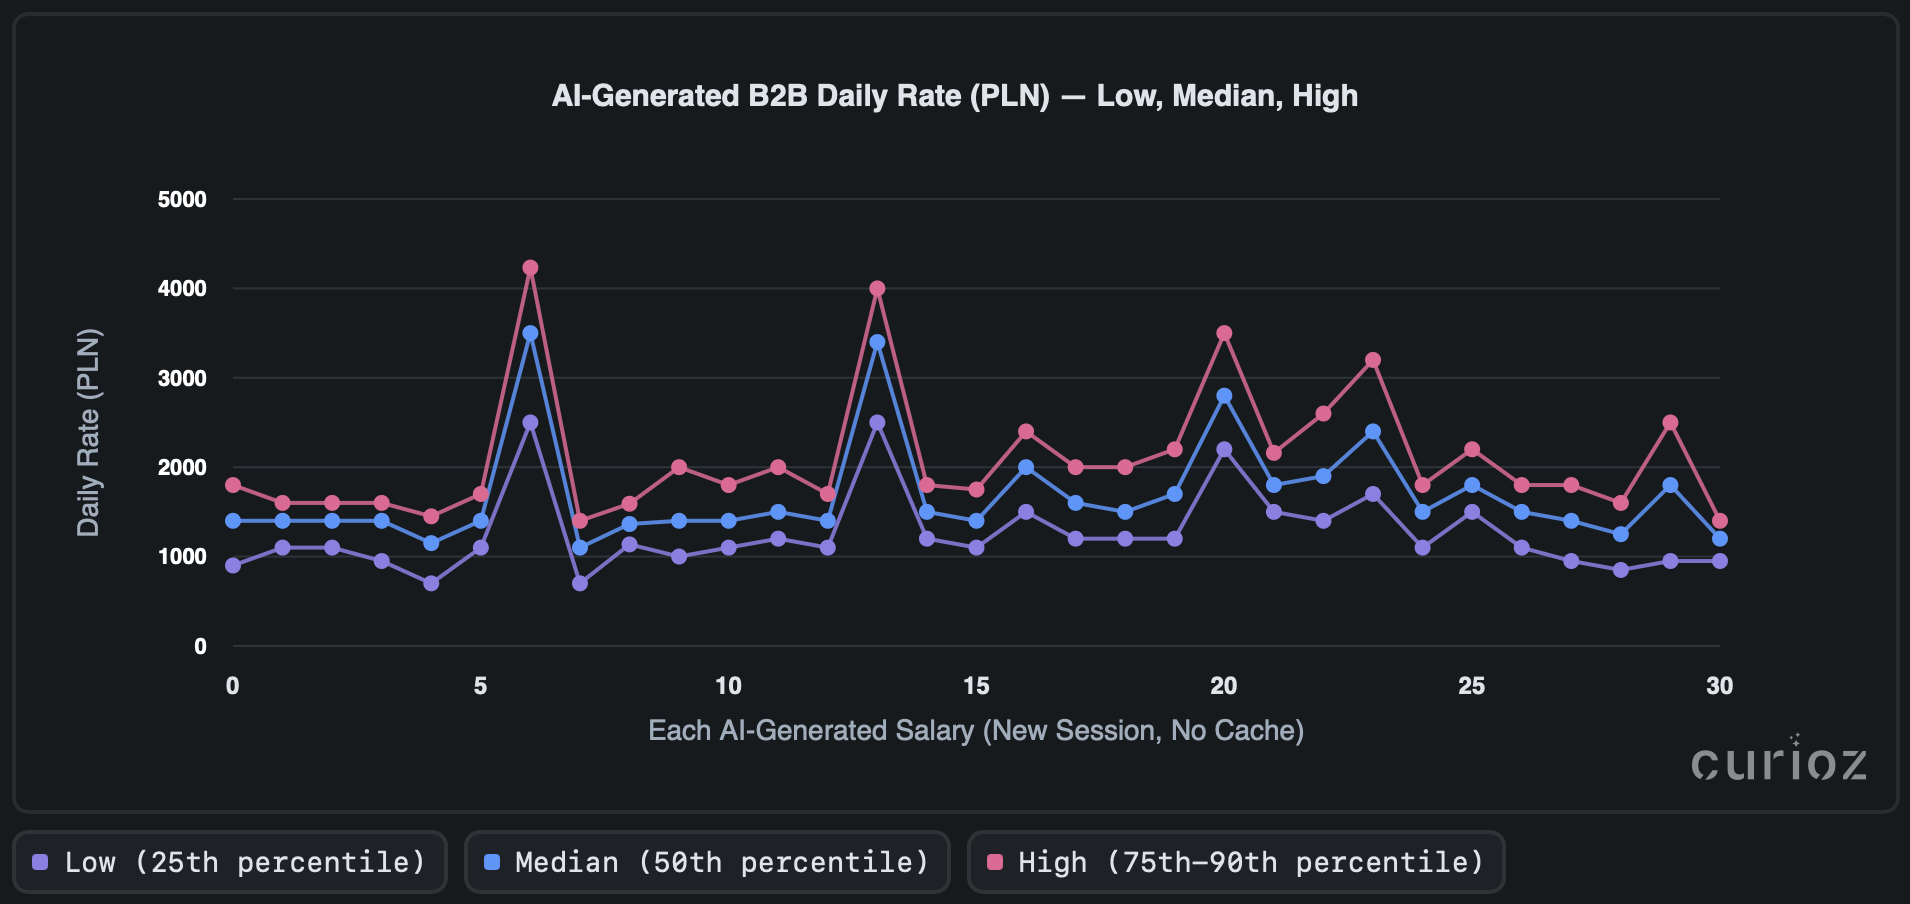
When you look at the hourly and daily rate charts, it’s clear they don’t line up. One might expect the daily rate to correspond to the hourly rate multiplied by the standard number of working hours at some extent. However, it is evident that the AI has generated the daily rate independently. While daily rates are becoming increasingly common in job offers, this discrepancy can be misleading for professionals engaged in benchmarking, particularly since multiplying the average hourly rate by eight hours produces daily rate values that deviate by up to 40%.
On the other hand, repeated tests for employment-based (UoP) contracts similarly reveal unstable output behavior. Most estimates fall within a ~900 PLN variability band, but the trace oscillates up and down, occasionally swinging by several thousand PLN. Clustering is evident, but with a high internal spread, and individual runs sometimes jump by hundreds to over 2,000 PLN. Approximately one-third of nominally identical queries diverge materially, with the median and upper quantiles showing the widest spread.
.png?width=1910&height=904&name=Image%2028-10-2025%20at%2014.49%20(1).png)
There are no confident clusters in the results. Even with the same prompt and setup, outputs vary substantially from run to run, indicating the AI is not consistent and is not drawing on the exact same evidence each time.
Can You Afford to Trust Your Prompt?
With this evidence, the question naturally arises: can you trust your prompt in business decision-making?
When identical AI inputs produce substantially different outputs, confidence in any single result becomes unreliable. For someone responsible for setting salaries or pricing roles, this inconsistency has real financial consequences.
Which numbers should you choose?
A “small” 100 PLN daily gap becomes several thousand PLN a month per employee. Across a team, that snowballs into tens or hundreds of thousands in budget drift. Hourly swings of 40–50 PLN distort bids and contracts. For monthly salaries, even a 10-15% variation can mean the difference between competitive offers and costly mispricing. Whether you are hiring Data Engineers, AI Engineers, QA Automation Engineers or any other IT professional a proper salary benchmarking might be a loss or win game. Mispricing an offer triggers a cascade: longer hiring cycles, candidate drop-off, and ghosting; higher rotation and re-recruiting costs; overpaying that blows salary bands, creates pay compression, and inflates budgets; contract renegotiations, distorted bids, and missed targets. Fix the benchmark, and you cut the downstream damage.
This domino effect has a cure, real market data. Curioz is built on reality, not AI speculation. We analyze thousands of job offers, signed contracts, and partner data monthly. Our figures come from observed market evidence and verified statistics, not AI runs. Our numbers are consistent, defensible, and decision-ready.
When decisions move millions, you can’t afford to guess.
Talent-as-a-Service (TaaS): On-Demand Capability, Compounding Impact
In 2025, speed, clarity, and adaptability win. TaaS gives you flexible access to the exact capabilities you need, when you need them, so work moves faster, decisions get sharper, and outcomes improve without adding permanent headcount.
Why TaaS?
- Faster outcomes → Stand up initiatives in weeks, not quarters.
- Flexible capacity → Scale up or down as priorities shift.
- Clear accountability → Outcome-based engagements with measurable goals.
- Lower risk → Try, learn, and adapt without long-term commitments.
- Seamless integration → Talent plugs into your processes, tools, and culture.
30/60/90 Engagement Pattern
-
0–30 days: Align & ProveDiscovery, goal setting, current state review, quick wins, and a clear success plan.
-
31–60 days: Build & ValidateExecute the plan, expand scope where it works, validate results against agreed metrics.
-
61–90 days: Scale & EmbedOperationalize what works, establish governance and handoffs, enable your team, and tune for cost and performance.
Where it Helps?
Strategy, operations, product, marketing, finance, risk, people, and any function that needs focused expertise to accelerate outcomes.
Competitors are already compounding advantages with flexible talent models. Add TaaS now to move faster, stay adaptable, and turn priorities into progress every quarter.
NOTE: This post is based on research by Inuits.it and Curioz.io, and has been crossposted on both platforms.